
3.9.3.2 Hubble's law and the big bang
Red shift $v = Hd$
Simple interpretation as expansion of universe; estimation of age of universe, assuming H is constant.
Qualitative treatment of Big Bang theory including evidence from cosmological microwave background radiation, and relative abundance of hydrogen and helium.
Intro
One of the amazing things about this branch of Physics, is that we are able to make observations here on Earth, or at least quite close to it, and through the application of Physics deduce the structure, lives, and process of a vast range of amazing astronomical objects. However astronomical observations still have the ability to show up the unexpected, which has, on several occasions in the last 100 years forced us to accept that there is still a lot that we do not know about the universe, and that there is still much for us to discover.
The expansion of the universe
The first of these major discoveries took place in 1929, when the American astronomer, Edwin Hubble related the redshifts of galaxies and their distances. He has already made important contributions to the field of astronomy, as his observations of variable stars in nebula had shown that they were in fact other galaxies as large as our own, but far beyond it. This discovery had opened up the size of the universe, from hundreds of thousands of light-years, to millions of light years.
At the time it had thought that the universe was either static, and unchanging, and had always been so, with no beginning and no end, or that the all pervasive force of gravity would be causing galaxies to move towards each other due to their mutual attraction. A few scientists, such as Georges Lemaitre, had suggested that the universe might be expanding, and might have some sort of origin, but up until Hubble’s work, there was no experimental evidence for this. Hubble took redshift data, collected by Vesto Slipher, who use photographic plates, such as the one in the image below, and plotted it against his distance measurements.

As can be seen from the images above, the greater the distance to the galaxy, the greater the redshift, shown by the amount that the two spectral lines are moved to the right. Hubble plotted recessional velocity vs distance using the relationship $z=\frac{v}{c}$, and produced the graph below which shows a roughly proportional relationship between distance and velocity.

The data on this graph do look a little un-correlated, and some local galaxies, such as Andromeda, are approaching us. This is due to the gravitational interaction between local galaxies, however when we look at galaxies further away the pattern becomes more correlated as you can see from the other graph of velocity against distance further below.
The conclusion from looking at these two graphs is that the greater the distance to the galaxy, the greater is its redshift, and the faster its recessional velocity. From this Hubble was able to use it to make a startling conclusion that backed up Lemaitre’s work, that the universe itself was in fact expanding. To understand why it is worth thinking about a couple of analogies.
Imagine a person measuring the speed of traffic by the roadside.
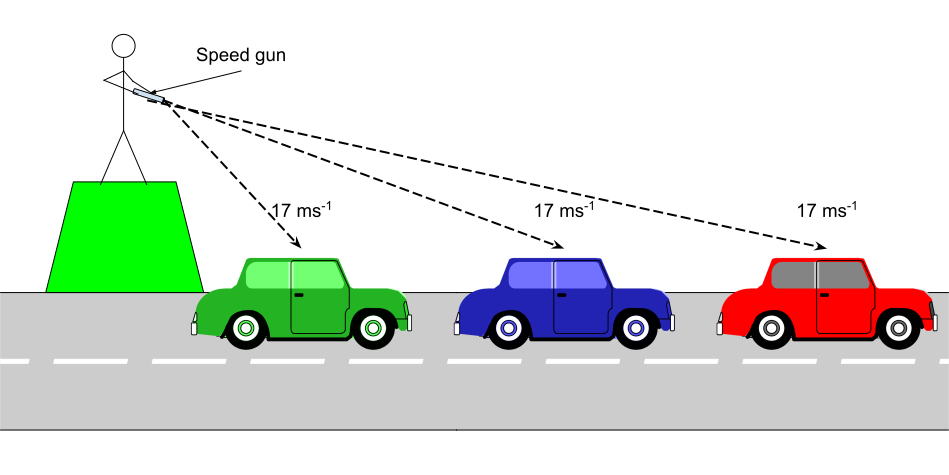
As each car goes past they measure its speed with a radar speed gun. Each car is moving at $\quantity{17}{ms^{-1}}$ as it passes the person, and then continues at the same speed. After three cars have passed, and all continued with zero acceleration, the person can conclude that all the cars have the same velocity and the distance to the car does not have any effect on its speed. The same would be true for galaxies moving through space, it wouldn’t matter the distance to the galaxy, they would all either be moving at the same speed, or at random speeds, with no overall trend and would therefore display the same redshifts, or completely random radshifts.
Whereas the trend identified by Hubble is more like a balloon, as in the photos below. The stars represent galaxies, or more correctly clusters of galaxies, at two times, $t\,=\,1$ which could be the distant past and $t\,=\,2$ which is the present day. At $t\,=\,1$ the silver galaxy (a) emits some light which then travels out in all directions with the same wavelength. At this point in time, the red galaxy (b) is $\quantity{1}{Mpc}$ away, and the blue galaxy is $\quantity{5}{Mpc}$ The balloon is inflated, which represents the universe expanding with time. The space between the galaxies starts to stretch as new space is created. As the light travels away from galaxy a, the expanding space stretches out the light and redshifts it to longer wavelengths. The greater the distance it travels, the more expanding space it passes through and the greater the redshift.
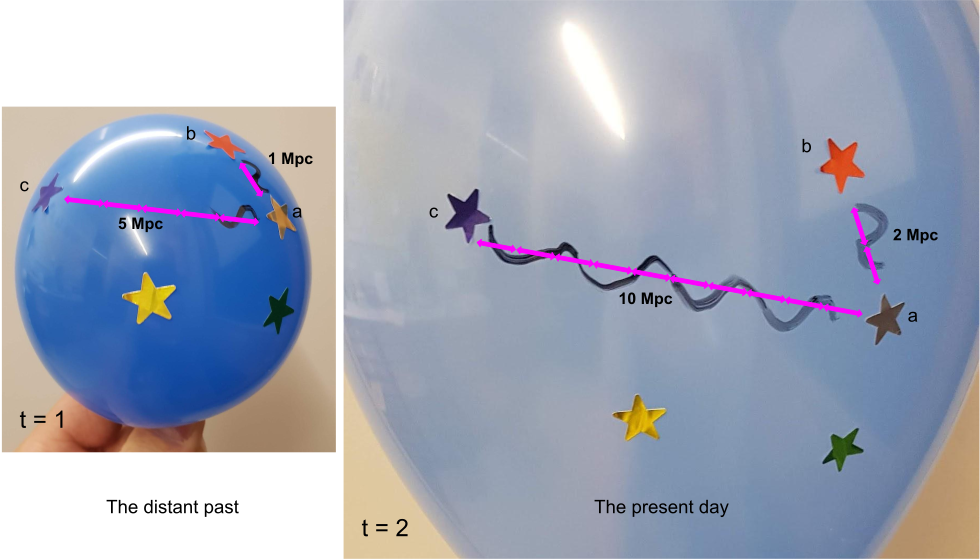
We can see that when light reaches galaxy b in the present day it has a much shorter wavelength than the light that has travelled further to reach galaxy c. We can even do some simple calculations with this simple analogy. In the present day galaxy b is $\quantity{2}{Mpc}$ away and galaxy c is $\quantity{10}{Mpc}$. They have both doubled their distance from galaxy a, but as this has taken the interval of time we can see that observers in galaxy c would see galaxy a recede with a greater velocity than an observer in galaxy b.
So the only conclusion from the observation that the further the distance to the galaxy the greater the redshift is that the whole universe is expanding and getting larger. As the relationship is proportional it can be expressed in the form $y=mx$
Where:
- $v$is the velocity of the galaxy in $\units{km\,s^{-1}}$
- $H$is a quantity known as the Hubble constant and has the value of $\quantity{65}{km\,s^{-1}\,Mpc^{-1}}$. The Hubble constant is the ratio of a galaxy’s recessional velocity to its distance from Earth.
- $d$is the distance to the galaxy in $\units{Mpc}$
The Hubble constant can also be found from the gradient of a graph of recessional velocity vs distance such as the one below:
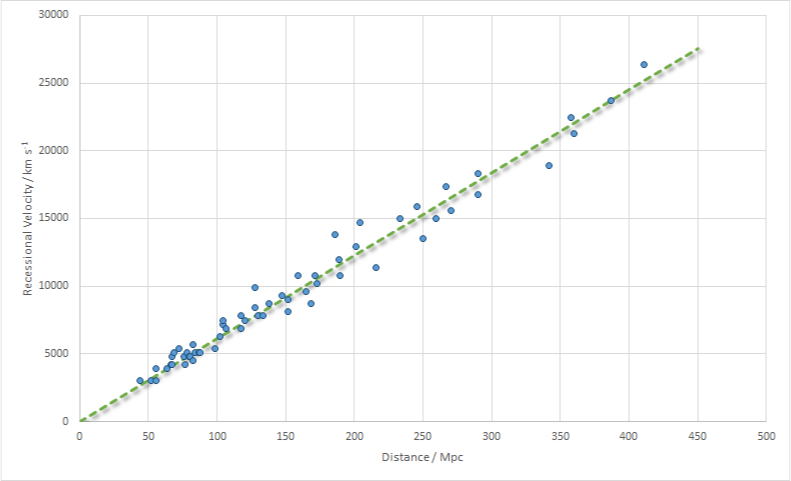
The value of the Hubble constant has varied a lot, Hubble himself measured it as $\quantity{50}{km\,s^{-1}\,Mpc^{-1}}$, and today it varies depending on how it is measured, but it is accepted that it is between $\quantity{60-70}{km\,s^{-1}\,Mpc^{-1}}$.
This relationship between redshift and distance can be used to calculate the distance to astronomical objects that might not be measurable using other methods such as parallax or standard candles. It is important to remember that the redshifts are not caused by the Doppler effect, but by the fact that the space through which the light is travelling is actually expanding.
If the universe is going to be larger in the future, then it follows that it was smaller in the past, and if we go back far enough we can get to a universe that had no spatial dimensions, a universal origin. We can use the Hubble constant to estimate the age of the universe.
The Hubble constant has units of $\units{km\,s^{-1}\,Mpc^{-1}}$ which have the dimensions:
A distance of $\quantity{1}{Mpc}=\quantity{3.08\times 10^{19}}{km}$ so $H$ can be expressed as $\quantity{2.11\times 10^{-18}}{km\,s^{-1}\,km^{-1}}$ or $\quantity{2.11\times 10^{-18}}{s^{-1}}$. The reciprocal of this value will give the age of the universe in seconds:
Worked Example
- Light arriving at the Earth from a distant galaxy is observed to be red shifted.
Explain, in terms of spectral lines, what the term red shift means. - The wavelength of a given line in the spectrum is $\quantity{5.40\times 10^{–7}}{ m}$ when measured using a light source in a laboratory on Earth. When the light from the distant galaxy is used for the measurement, the wavelength is found to be $\quantity{5.61\times 10^{–7}}{ m}$.
- Show that this wavelength change corresponds to a frequency shift of about $\quantity{2.1\times 10^{13}}{ Hz}$.
speed of light in a vacuum, $c = \quantity{3.0\times 10^{8}}{m\, s^{–1}}$ - Calculate the speed of the galaxy relative to Earth.
- Estimate the distance, in m, between the galaxy and the Earth.
Hubble constant = $\quantity{65}{km\,s^{-1}\,Mpc^{-1}}$
$\quantity{1}{ pc}$ (parsec) = $\quantity{3\times 10^{16}}{ m}$
This question does not ask you to explain how the spectral lines are shifted, but just what red shift means in this context. In a question like this it is important to explain clearly and use the correct scientific terminology. When spectral lines are re shifted, they are moved to a longer wavelength, or towards the red end of the spectrum.
Frequency and wavelength are related by the equation $c=f λ$
The frequency shift is the difference between the observed frequency and the laboratory frequency.
The frequency shift is absolute, so the minus sign is not really important in this context.
As this is a show that question, it is important that the answer is given to one more significant figure than the data stated in the question.
The speed of the galaxy can be calculated from the Doppler relation:
We have already calculated the lab frequency as part of the previous question, $\quantity{5.556\times 10^{14}}{Hz}$. So we can substitute this and the figure for frequency shift from the previous part into the Doppler formula:
We now know the velocity and, given the Hubble constant, we can estimate the distance to the galaxy. As $H$ is given in units of $\units{km\,s^{-1}\,Mpc^{-1}}$ we must first convert the calculated speed into $\units{km\,s^{-1}}$.
\begin{align} d&=\frac{v}{H}\\ d&=\frac{\quantity{1.12\times 10^{4}}{km\,s^{-1}}}{\quantity{65}{km\,s^{-1}\,Mpc^{-1}}}\\ \\ d&=\quantity{172}{Mpc} \end{align}
We must now convert the calculated distance from $\units{Mpc}$ to $\units{m}$.
A distance of $\quantity{1}{ pc}$ (parsec) = $\quantity{3\times 10^{16}}{ m}$ so $\quantity{172}{Mpc}$ is:
The big bang
If the universe has a finite age then it suggests that at some point around 15 billion years ago it must have had an origin. The universe is a closed system, which means that there is no more matter/energy in it now than there was in the past. So if the universe was smaller in the past, that amount of matter must have been squeezed into a smaller volume. Remembering the relationship $V\propto T$ it also follows that a smaller universe must have been a hotter universe.

Therefore scientists working at the time of Hubble’s discovery came to the conclusion, that if the universe did indeed have a beginning, it must have been a very hot one! The term big bang was coined as a derisive term, but it has stuck. The theory suggests that the universe started from a single infinitely dense point that began to expand rapidly outwards, cooling as it expanded. In its early history (the first 3-4 minutes!) it went through several epochs (some lasting just a small fraction of a second) which saw matter coalesce out of pure energy, the four fundamental forces become de-unified, free quarks confined inside hadrons, antimatter annihilating with normal matter and the first simple nuclei form. Although it is a fascinating subject, you do not need to know the details of the big bang, or its moment by moment timeline, although there are many good books, and I have outlined it here.
What you do have to know however is the evidence that supports the theory that the universe came into being in a hot big bang event. Many working scientists did not like the big bang theory, instead arguing that the universe had been around forever. They put forward a steady state theory which said that space was expanding, which explained Hubble’s law, but new matter was constantly being created to keep the density of the universe constant. Big bang theorists needed to provide evidence that the universe did indeed start with a super-hot fireball.
Cosmic Microwave Background Radiation
As the early universe was theorised to have emitted radiation at the rate it absorbed it, it is a very good approximation to a perfect blackbody. Scientists calculated, by considering the relative proportions of hydrogen and helium, and applying the same physical principles of nuclear fusion as in the core of a star, predicted that the temperature of the universe when these simple nuclei formed was around $\quantity{10^{9}}{K}$ and then by applying the gas laws and Wien's law it was predicted that the universe should have a current blackbody temperature of $\quantity{3.68}{K}$ with a peak wavelength of $\quantity{7.87\times 10^{-2}}{cm}$.
In 1964 two scientists, Arno Penzias and Robert Wilson, who were working at the Bell Laboratories in the USA, discovered a constant static noise where-ever they pointed their telescope. After accounting for all sources of noise including, electrical, atmospheric, as well as evicting a family of nesting pigeons and cleaning out a “white material familiar to all city dwellers” they determined that this noise had a blackbody spectrum with an equivalent temperature of $\quantity{3.5}{K}$. This spectrum had its peak wavelength in the microwave part of the electromagnetic spectrum.
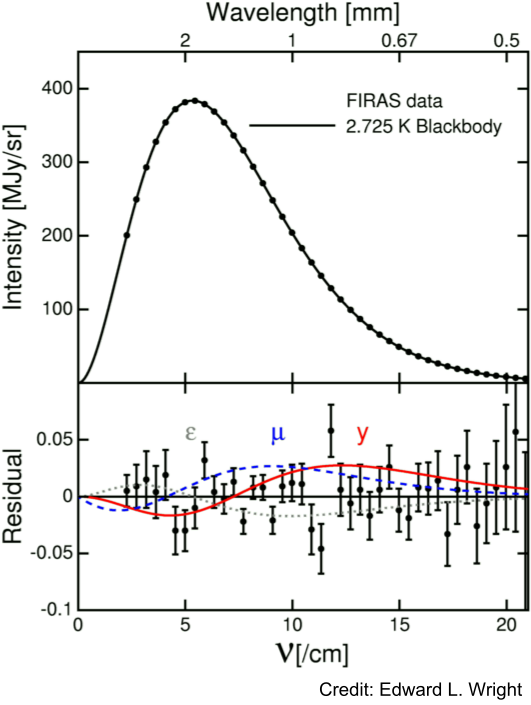
This noise which was in the microwave spectrum was the heavily red-shifted remnants of the early universe, and the first direct piece of evidence of a hot big bang. It is thought that this radiation originates from around 100,000 years after the big bang when the universe became cool enough for electrons to bind to the hydrogen and helium nuclei to form the first atoms. This is called recombination, and is the first time that the universe became transparent to light. It would be impossible to see further back in time than this using light, as before recombination, all of the universe’s photons had a very short mean free path between absorption and emission. Importantly this noise was incredibly uniform, fluctuating by as little as $\pm\quantity{0.003}{K}$, and was the same in all parts of the sky. This tells us that the universe is both homogeneous (the same at all points) and isotropic (looks the same in all directions), which are both important conditions of the big bang theory.
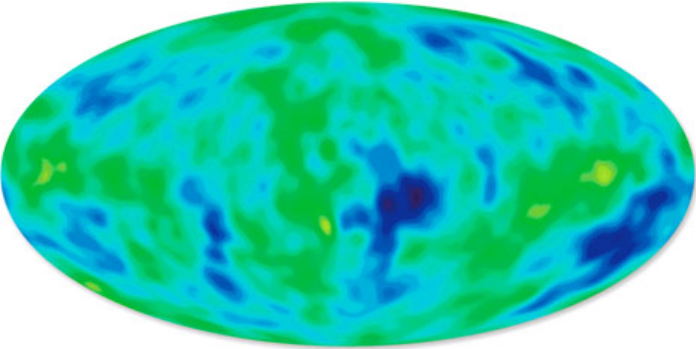
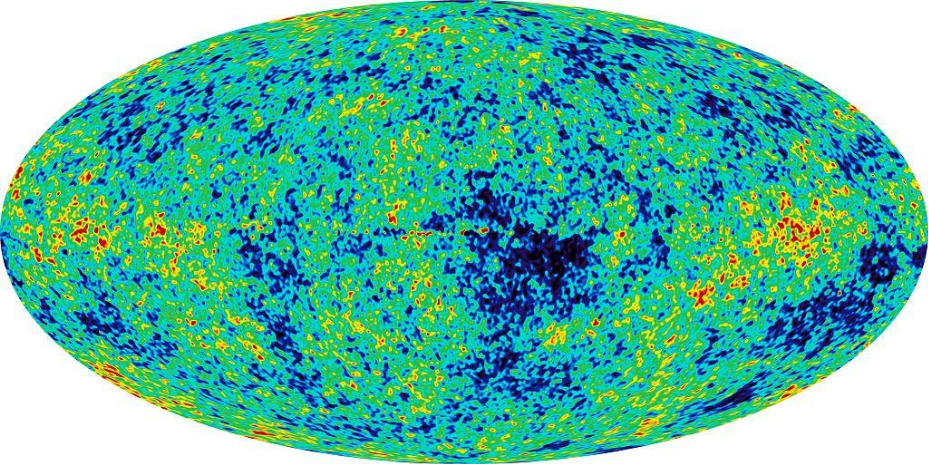
Since then, this Cosmic Microwave Background Radiation (CMBR) has been measured more and more precisely, and calculations with it have narrowed down the age of the universe to around 13.82 billion years. Below are three images of the CMBR taken in increasing detail by the satellites, COBE, WMAP, and Planck. However, as is often the case with cosmology, the more we find out with the CMBR, the more new questions we have about the structure and origins of the universe.

Evidence from hydrogen and helium
When we look around us, we see that the objects around us are made from quite a few different elements including, iron, carbon, oxygen, silicon and aluminium. However astrophysicists would consider these elements to be trace pollutants as they make up less than 1% of the atoms in the universe. Over 90% of the matter is made up from just hydrogen and helium, and the proportions of hydrogen and helium provide more evidence for the hot big bang.
Neutrons are slightly heavier than protons, and are therefore more unstable. An isolated neutron has a lifetime of around 15 minutes. In the early universe the temperature was so hot that neutrons were decaying into protons at the same rate that they were being created. As the universe cooled neutrons started to decay faster than they were created and the proportions of protons to neutrons changed in favour of protons. Free neutrons were quickly bound into nuclei of deuterium and then helium. The period of time is called big bang nucleosynthesis and took place when the universe was around $\quantity{100}{s}$ old. Calculations suggest that the ratio of protons to neutrons should be around 7:1. If the universe had cooled quicker then the ratio would favour more protons, and if it had cooled slower it would have favoured neutrons. Other competing theories predicted a much lower proportion of neutrons.
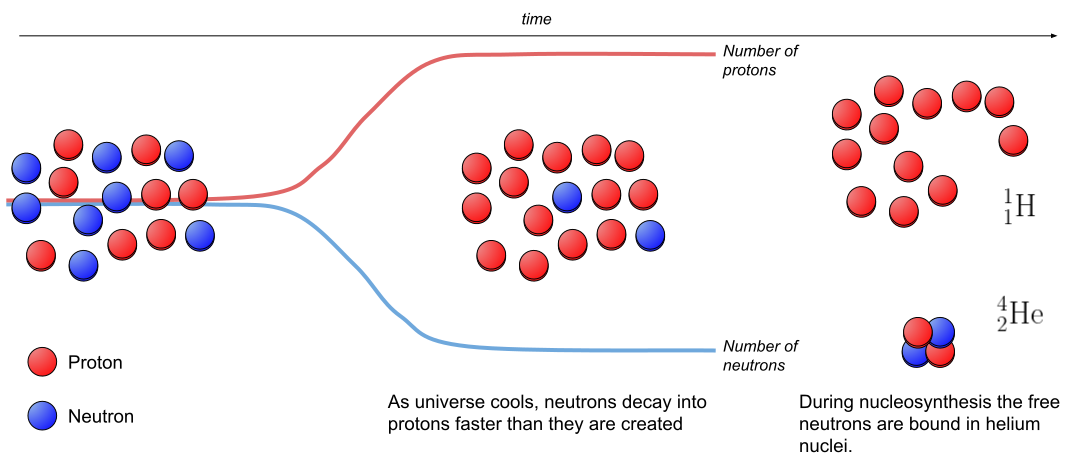
This ratio would produce 12 hydrogen nuclei for every 1 helium nucleus, which has a mass ratio of 3:1 hydrogen to helium. This was a clear prediction of the big bang theory and its confirmation by observation is one of the theory’s biggest achievements.
Dark energy
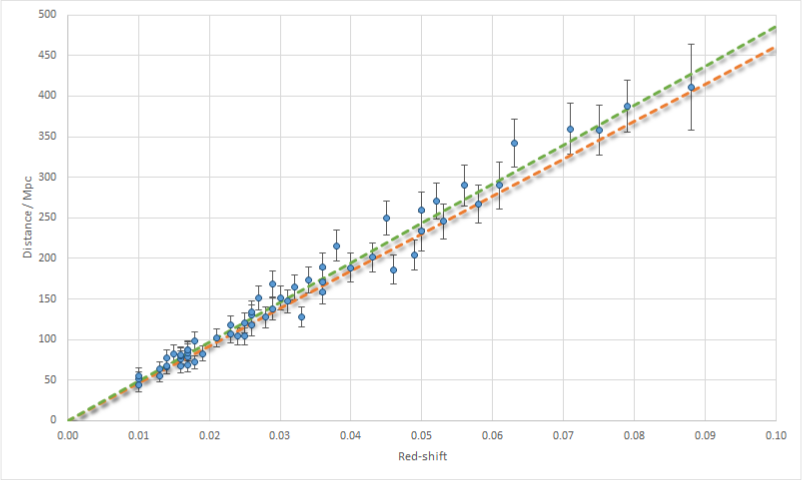
Although the value of the Hubble constant is hard to pin down, (there are different values depending on what is being measured) measurements from astronomical objects up to a relatively large distance ($\quantity{500}{Mpc}$) shows a linear relationship between the redshift and the distance. The graph below shows the distance to several type 1a supernova and their redshifts. The green best fit line is for the plotted data, and the orange line shows the trend for a Hubble constant of $\quantity{65}{km\,s^{-1}\,Mpc^{-1}}$.
However in the late 1990s, observations made by the Supernova Cosmology Project uncovered something surprising. It was thought that the gravitational interaction between clusters of galaxies on a large scale would be slowing the rate of expansion, and scientists at the SCP were looking for evidence of this. They were making observations of type 1a supernovae at great distances, and they discovered that at large distances these supernovae were dimmer than the should have been for their observed redshifts. Their results are shown in the graph below, which was plotted using the original data. The green and orange lines represent what they did in the previous chart, and the blue line is the best fit for these data.
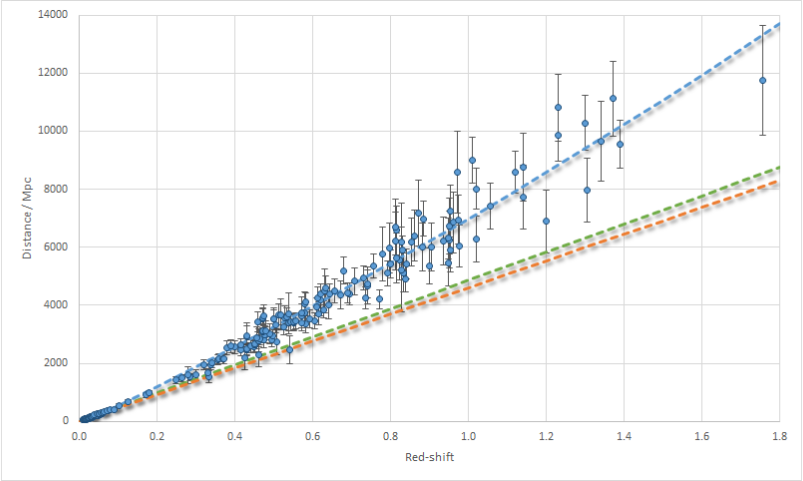
After accounting for dust, and other sources of interference they came to the conclusion that these distant galaxies (which contained the supernovae) were moving away faster than local ones, and that the rate of universal expansion was in fact accelerating and not slowing down. This was a groundbreaking discovery, as no mechanism known to science could explain it. Scientists suggested some mysterious anti-gravitating substance that was dubbed dark energy.
This conclusion has since been backed up by other lines of research, however no one really knows what dark energy is.
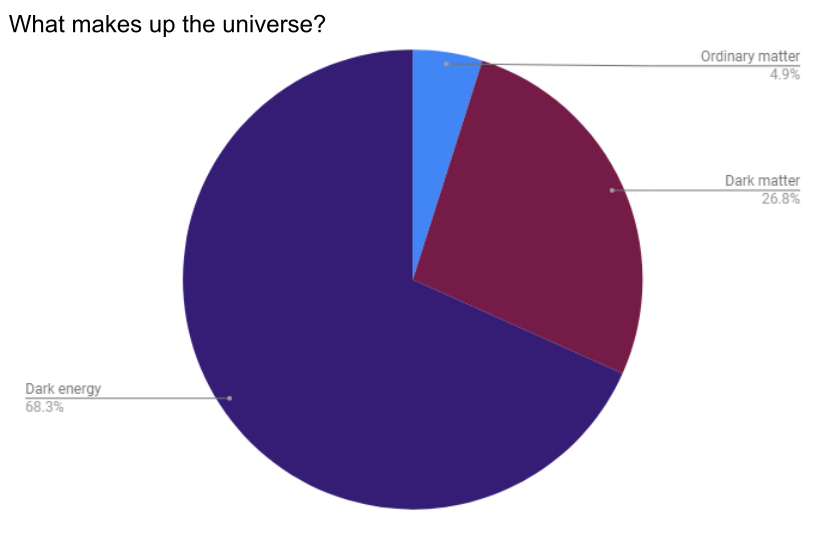
You may have also heard of dark matter, but it is important not to get these confused. Dark matter is also a mystery to modern physics, but is involved with gravitation and holding galaxies, and clusters together. (You do not need to know about dark matter for your A levels.) There are many suggestions as to what the source of dark energy might be, including quantum fluctuations of space itself, or a new as yet undetected fundamental force. What we do know, however, is that the mass equivalent of dark energy accounts for over 68% of the entire mass of the universe, with ordinary matter (quarks, leptons and photons) making up just 5%. Whatever dark energy turns out to be, it is very mysterious.
Quasars
Quasars are very bright compact objects that exhibit huge redshifts.
When first observed in the 1950s, quasars appeared to be very bright point like sources of light which emitted a strong radio signal, very much like stars. The only thing that differentiated them was a strange spectrum. It turned out that these strange spectra was due to hydrogen and magnesium lines that had been hugely redshifted. Hence they were called quasi-stellar radio sources or quasars. The large redshifts meant that they must have been at vast distances from Earth, but their relatively bright apparent magnitudes (around 12) meant that they must also have been very bright. The picture below, taken by the Hubble Space Telescope is of the first quasar to be discovered. It is at a distance of $\quantity{580}{Mpc}$ or $\quantity{1.9\times 10^{9}}{ly}$, but has an apparent magnitude of 12. However its absolute magnitude is -26, which is about the same as the Sun’s apparent magnitude. So if this quasar was placed at a distance of $\quantity{10}{pc}$ it would appear as bright as the Sun!

The sources of all this energy remained a mystery. They were bright, but compact, and very far away. It was soon discovered that they were all at the centre of ancient galaxies, leading to the theory that quasars were supermassive black holes at the centre of young galaxies. Their brightness came from matter falling into them and heating up as it lost its gravitational energy. The quasar above has a mass of nearly a thousands million Suns. They are considered to be a type of active galactic nuclei (AGN), of which the different types are identified by their different spectra.
Quasars can also shine brightly in other parts of the spectrum. The photo below shows two images of the same quasar, one in the visible spectrum (left), where the quasar is the brightest object in the photo (bottom right corner) and one in the x-ray spectrum (right) in which the quasar still glows very brightly.
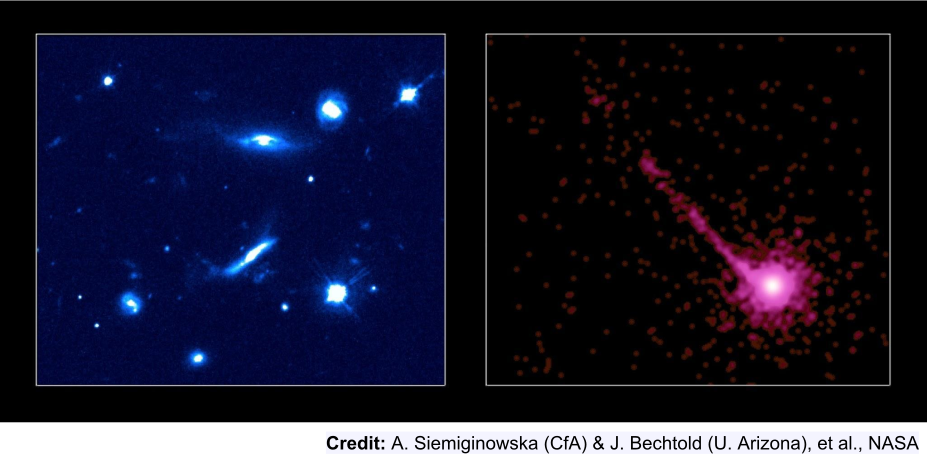
Quasars also support the bigbang theory of the universe. As there are no local quasars, it suggests that they only existed in the early universe. Therefore the universe has changed as it has aged, something that cannot be explained by the steady state model.