3.9.3.1 Doppler effect
$\frac{\Delta f}{f}=\frac{v}{c}$ and $z=\frac{\Delta \lambda}{\lambda}=-\frac{v}{c}$ for $v\lt\lt c$ applied to optical and radio frequencies.
Calculations on binary stars viewed in the plane of orbit.
Galaxies and quasars.
3.9.3.4 Detection of exoplanets
Difficulties in the direct detection of exoplanets.
Detection techniques will be limited to variation in Doppler shift (radial velocity method) and the transit method.
Typical light curve.
The Doppler effect
So far within this module we have examined how we find out about the composition, distance to, and the temperature of stars by observing their colour and brightness. However it is also possible to discover information about the motion of stars, and other astronomical bodies by making careful observations of their light.
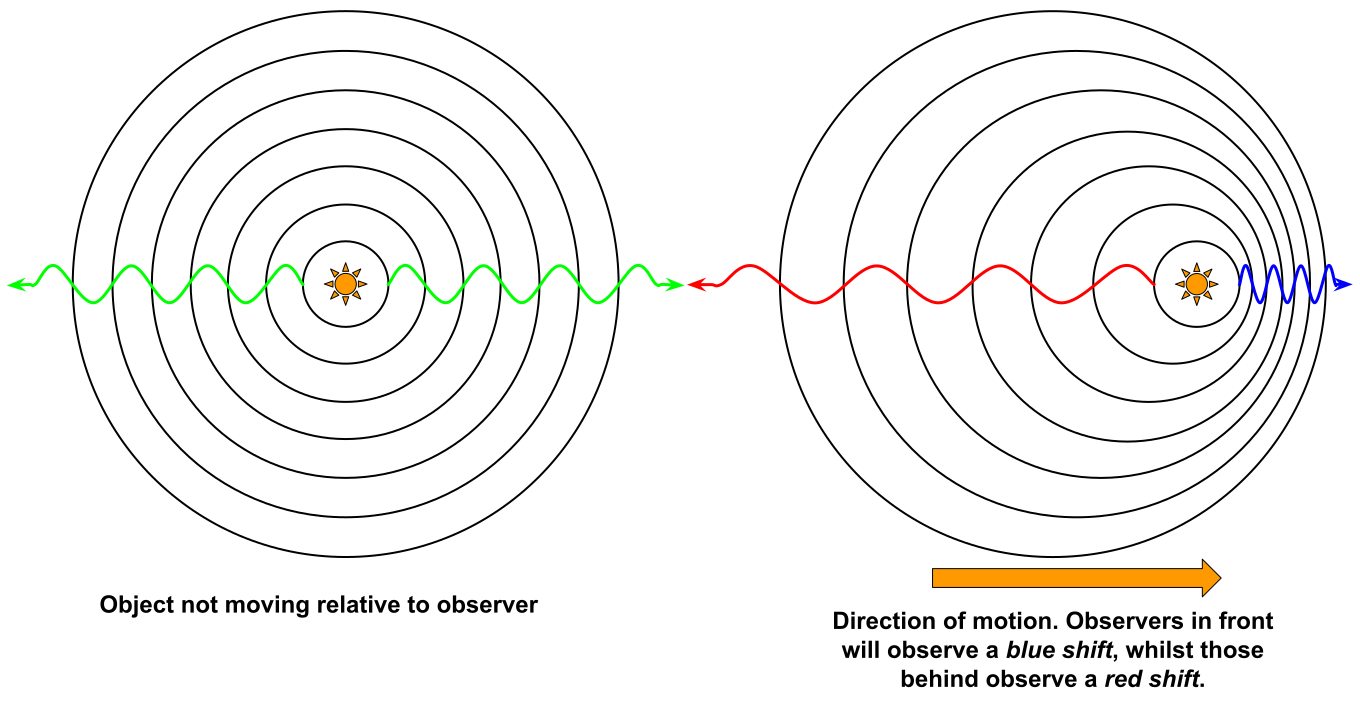
When an object is stationary emits light, or has light reflected off its surface, that light spreads out uniformly so that wherever an observer receives the light it would appear to have the same wavelength. However, if the source of light is moving relative to the observer, the observed wavelength changes depending on whether the motion of the light source is towards or away from the observer.
If the light source is moving towards the observer, as the source emits a wavefront, it continues moving. The wavefront moves out at equal speeds in all directions, but as the source moves, its relative speed to the wavefront in the direction of its motion is lower. As the source still emits at the same frequency the observer will see a shorter wavelength than when observing the stationary source. As the wavelength would move towards the blue end of the visible spectrum this is called blue shift.
When the source is moving away from the observer the relative speed between the source and the wavefront is greater, and the observed wavelength also increases. As this would move the wavelength towards the red end of the spectrum this is called red shift.
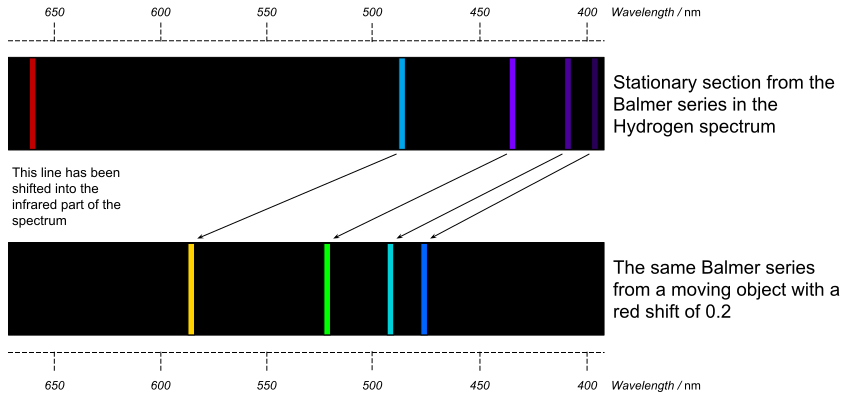
As the amount that the wavelength changes is directly proportional to the speed of the source, observations in the shift of spectral lines can be used to determine its speed. The fractional change in the wavelength is called the red shift, whether or not the object is moving towards or away from the observer, and is given the symbol $z$.
The equation for the amount of red shift can be derived if we imagine a star, moving away from Earth with a velocity, $v$, which is emitting light of a wavelength $λ$ and speed $c$.
The time between two consecutive peaks on the wave can be given by:
Which we can see has the units of:
By the time the next wave crest is emitted, the first will have travelled a distance of $λ$ and the star will have travelled:
The two crests of the wave are separated by a distance of:
As the change in the wavelength is equal to the amount that the source has moved between mitting to crests we can say that:
So,
This equation only applies to objects travelling at speeds much much less than the speed of light, otherwise relativistic effects have to be taken into account. If the red-shift, $z$ is positive the the object is moving away from the observer, and if it is negative then the object is moving towards the observer.
The fractional change in the frequency can also be used to find the red shift:
Most working astronomers, and books calculate $Δλ$ as $Δλ=λ_{obs}-λ_{lab}$ where the observed wavelength from the moving source is ($λ_{obs}$) and the wavelength observed in a laboratory ($λ_{lab}$), and calculate $Δf$ the other way around as $Δf=f_{lab}-f_{obs}$. But AQA suggest calculating both $Δλ$ and $Δf$ as:
- $Δλ=λ_{lab}-λ_{obs}$
- $Δf=f_{lab}-f_{obs}$
And then calculate the redshift using:
Notice the negative sign in front of the first term, this ensures that negative values of $z$ are still moving towards the observer and positive values of $z$ are moving away.
Worked example

The Doppler effect can be used to make measurements of the Sun and how fast it is rotating on its axis. One edge of the Sun is approaching the Earth and the other is moving away. A line in the Hydrogen spectrum taken from the eastern limb (left side) is measured to have a wavelength of $\quantity{434.044}{nm}$ and the same line taken from the western limb (right ride) is found to have a wavelength of $\quantity{434.050}{nm}$
The rest wavelength of the same line in the hydrogen spectrum was found to be $\quantity{434.0472}{nm}$.
- Calculate the rotational velocity of the Sun.
- Which side of the Sun is approaching us? Explain why.
- Calculate the rotational period of the Sun.
The Sun’s radius is $\quantity{6.955\times10^{8}}{m}$
We have been told the observed wavelength on either side of the Sun, and we can use these values to calculate the average change in wavelength, $Δλ$:
We can now use the Doppler equation to calculate the Sun’s rotational speed:
The eastern limb of the Sun has a hydrogen line which is observed to be at a shorter wavelength that of the stationary hydrogen spectrum, so it has been blue-shifted and therefore must be moving towards us.
We can solve this by using the equations of circular motion,
And
The time period is $\frac{1}{T}$ so we can rearrange the above equations to get:
Binary stars
It is now thought that around 50% of stars do not exist on their own, like the Sun, but in fact come in pairs, called binary systems. Some stars even exist in three star systems! Binary stars orbit a common centre of mass, with the more massive star orbiting closer to the centre of mass. By making observations of the Doppler shift in the spectra from these stars we are able to deduce information about the stars’ mass and speed. In fact this method is the only reliable way of calculating stellar masses, single star systems have their mass estimated by matching the stars properties to those found in binary systems.
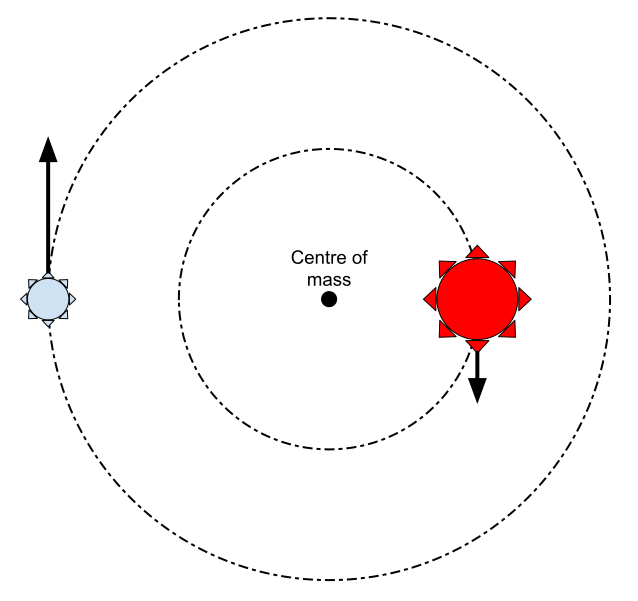
If the two stars’ angular separation is large enough, the individual stars can both be resolved using a telescope. These systems are called visual binaries. However, most binary systems are too far away to be able to resolve the individual stars. These systems are called spectroscopic binaries and they can only be identified by looking at their spectra, or their light curves.
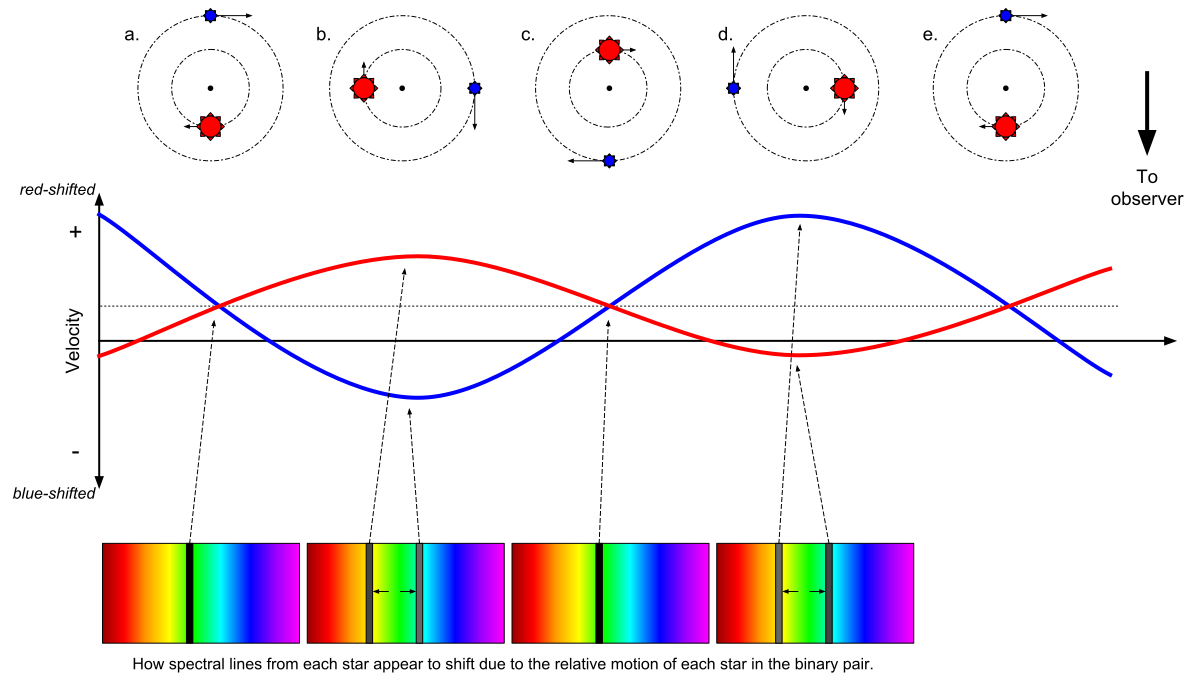
In the diagram below, two stars orbiting each other are observed using a spectrometer to view their spectral lines. A position a. neither star is moving relative to the observer on Earth, so the spectral lines form each appear at the same wavelength. At position b. the red star is moving away from Earth, so its spectral line is red-shifted and the blue star is moving towards Earth, so its spectral line is blue-shifted. As a result, two separate lines can be viewed, and the amount of shift can be used to determine the speed of the stars using $v=-\frac{Δλ}{λ}$. This is called the radial velocity method. The constantly shifting pattern of spectral lines can also be used to find the period of the the stars’ orbit and the mass of the system
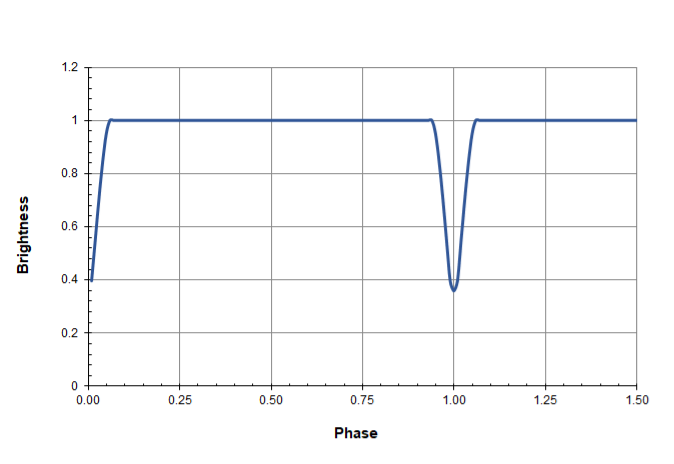
Binary systems can also be investigated looking at how the apparent magnitude of the two star varies over a long period of time. As one star transits in front of the other, some of its light is absorbed and the apparent magnitude is reduced. When the more luminous star is partially eclipsed the reduction in brightness is larger than when the dimmer star is eclipsed. This transit method produces light curves similar to the one below with periodic dimming, which again can be used to measure the orbital period and radii of the stars.

Exoplanets
Our Solar system contains eight planets, several dwarf-planets, thousands of asteroids and comets, but it seems that our system is not unique, and in fact most other stars also have planets orbiting them. As of 2018, 3,735 exoplanets have been discovered orbiting around other stars. Hundreds of them being in multiple planetary systems.
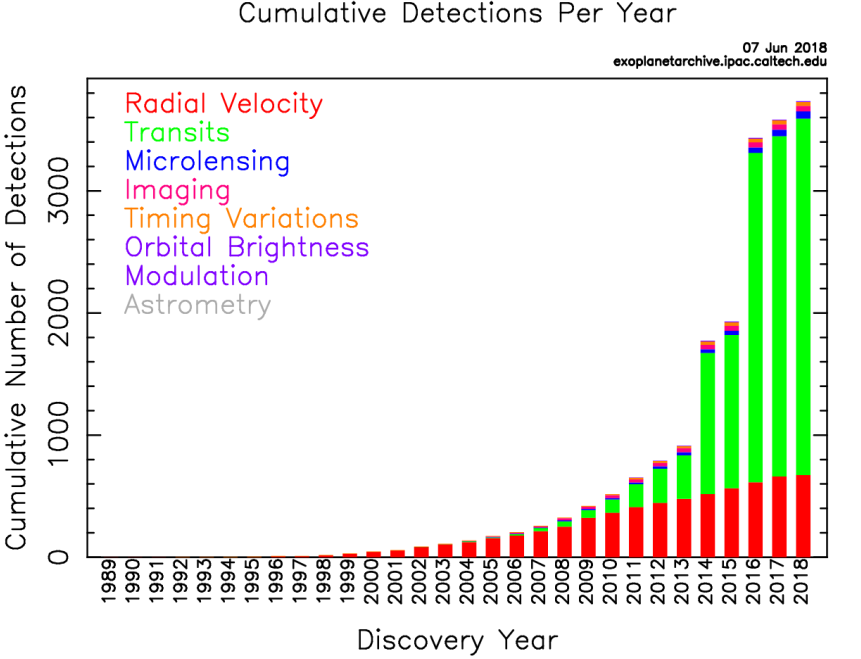
Exoplanets are hard to spot as they are very small compared to their stars and are far enough away to make resolving them difficult. They can, however, be discovered in many ways, the main techniques used being:
- The transit method
- The radial velocity method
- Direct Imaging
- Gravitational microlensing (you will not be asked about this method in your exams)
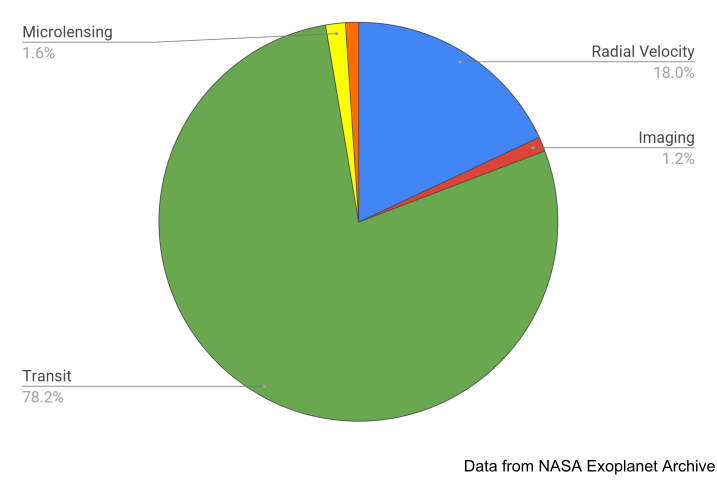
The transit method is the most common method of exoplanet detection, and one that produces so much data that much of it is released so that members of the public can join in the search for extrasolar worlds. Over 78% of planets are discovered in this way.
This method is the same as the method for detecting binary stars, but the light curve has a slightly different shape, as the planet will absorb the star’s light, but doesn’t produce any of its own.
This method is only suitable for planets with a short orbital period, otherwise observations need to be made over very long periods of time. Nevertheless, this method has discovered some very strange planets, such as ‘hot Jupiters’ that orbit their star very quickly. This method is also suitable for detecting smaller, Earth sized planets.
The radial velocity method has also discovered many exoplanets. This relies on the gravitational interaction between the star and the planet, as between two binary stars. Obviously this effect is much smaller due to the small mass of the exoplanet. Nevertheless, using very sensitive spectrometers, a periodic Doppler shift can be seen as the planet orbits the star.
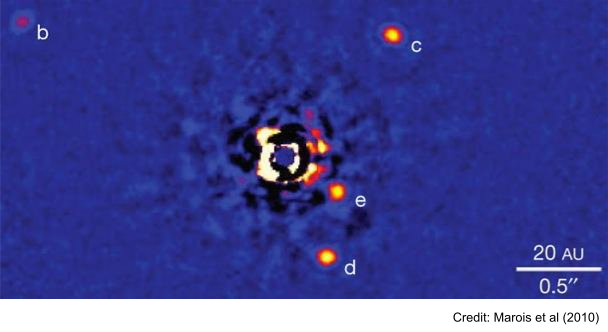
In recent years it has been possible to even take direct images of exoplanets, as in the picture below. This can only be done for larger planets, which orbit at large distances from their stars, due to the small angular size. The parent star would also be so much brighter than the planet as to make detection impossible.