
On this page:
3.1.2 Limitation of physical measurements
Random and systematic errors.
Precision, repeatability, reproducibility, resolution and accuracy.
Uncertainty:
Absolute, fractional and percentage uncertainties represent uncertainty in the final answer for a quantity.
Combination of absolute and percentage uncertainties.
3.1.3 Estimation of physical quantities
Orders of magnitude.
Estimation of approximate values of physical quantities.
During A level Physics you will be expected to design investigations as well as collect accurate data during guided practical work from which to draw conclusions. It is important that practicals are carried out carefully to reduce errors and uncertainties.
Errors can either be systematic, or random. Systematic errors are factors which have a predictable result, and can therefore easily be accounted for. These usually arise from poor equipment set-up, such as a zero error, which could easily be subtracted from (or added to) each result.
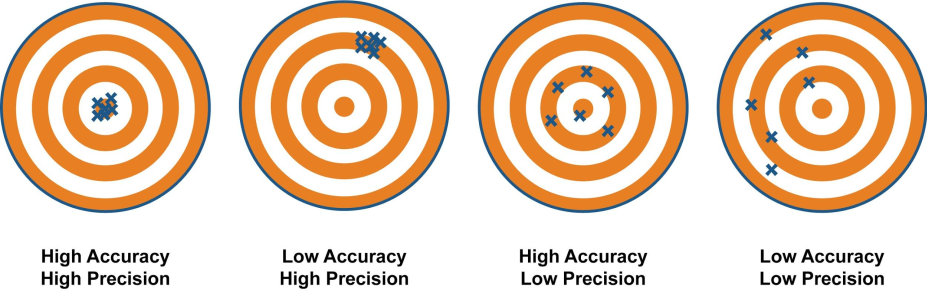
Random errors are harder to account for as they vary in size. They can be due to reaction time, or any unpredictable source. The best way to deal with them is to take multiple readings and find a mean. This will allow for the random error to fluctuate, and hopefully, cancel out. Figure 1 below shows the difference between precise and accurate results.
It is important to understand and use the following terms correctly, you will need them when writing up your CAPs:
- Precision: Precise measurements are ones in which there is very little spread about the mean value. Precision depends only on the extent of random errors – it gives no indication of how close results are to the true value.
- Accuracy: A measurement result is considered accurate if it is judged to be close to the true value. This would usually apply to mean values rather than individual readings.
- Repeatability: A measurement is repeatable if the original experimenter repeats the investigation using the same method and equipment and obtains the same results.
- Reproducibility: A measurement is reproducible if the investigation is repeated by another person, or by using different equipment or techniques, and the same results are obtained.
- Resolution: This is the smallest change in the quantity being measured (input) of a measuring instrument that gives a perceptible change in the reading. When stating values in a table that have been measured with a particular device, the values should not be stated to a higher resolution than can be measured.
Common exam mistake
Two pairs of terms here are routinely mixed up. Precision and accuracy are not the same thing — a set of results can be tightly clustered (precise) while still being nowhere near the true value (inaccurate), which is exactly what Figure 1 shows. Similarly, repeatability and reproducibility both mean “you get the same results again”, but repeatability is about the same person repeating with the same equipment, while reproducibility is about someone else, or different equipment, getting the same answer. Always check which one a question is actually asking about before you answer.
Uncertainties
All measurements, no matter how well taken, have some level of uncertainty associated with them. No measurement is perfect, and we need to recognise this when we state values during practical work. Although uncertainty cannot be eliminated, it can be reduced by choosing our measurements carefully.
When we make an individual measurement the uncertainty is usually the resolution of the instrument. If we can improve the resolution of the device, as we can with a multimeter, then we can reduce the uncertainty of the measurement. When using a device with a fixed resolution, like a ruler, if we make the measurement as large as possible, then the percentage uncertainty can be reduced.
Worth remembering
You can’t change a ruler’s resolution, but you can change how you use it. Measuring the length of ten coils of a spring rather than one, or the time for twenty oscillations rather than one, keeps the same absolute uncertainty from the instrument but divides it across a much larger measured value – shrinking the percentage uncertainty for free, without needing any better equipment at all.
When making multiple readings and finding the mean, the uncertainty is half the range of the results:
The uncertainty estimated in these two ways should be stated as: 14.3 ± 0.1 cm. This is called the absolute uncertainty and it is often given the symbol Δ.
The uncertainty can also be stated as a percentage of the measured value. This is called the percentage uncertainty, ε. This can be calculated by taking the absolute uncertainty and dividing it by the mean, or measured value as below.
In some situations it may be necessary to combine uncertainties. For example, if calculating the resistance of an electrical component with a single current and voltage reading, each with an associated uncertainty, then we would add the percentage uncertainties for these two readings.
If we are adding two or more values we add the absolute uncertainties.
Common exam mistake
Whether you add absolute or percentage uncertainties depends entirely on what you’re doing with the quantities, and mixing the two up is one of the most common ways to lose marks on this topic. If you’re adding or subtracting values (finding a length by subtracting two ruler readings, say), add the absolute uncertainties. If you’re multiplying or dividing values (calculating resistance from $V$ and $I$, or a density from mass and volume), add the percentage uncertainties instead. Stop and identify which operation you’re performing before reaching for either rule.
Uncertainties are a bit more complicated than what has just been described. This is just an introduction, and you should refer to the AQA practical guide.
For a more mathematical description of treating uncertainties and data click here (downloads a Word document)
Significant figures
When performing calculations it is important to consider the number of significant figures to which you state your answer. Significant figures can be hard to get your head around, but there are just a few simple rules,
- 1, 2, 3, 4, 5, 6, 7, 8, 9 are always significant. So the number 346.43 has five significant figures
- Preceding zeros are never significant, 0.00683 is three significant figures.
- Zeros between other numbers are always significant, 500.7 has four significant figures.
These three rules are standard and applied everywhere, but different people treat trailing zeros differently. In my class I will stick to the following rule,
- Trailing zeros will be treated as significant, i.e. 100 is three significant figures.
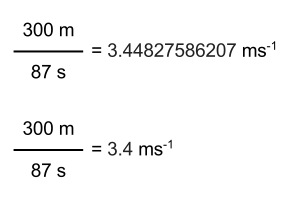
When presented with data for a calculation we need to make sure that the result of the calculation is stated to an appropriate number of significant figures. We should look at the data presented to us and make sure that the answer is stated to the fewest number of significant figures in the question. In the example below the time, 87 s, is given to only two significant figures, so the answer must be given to two significant figures, as shown in Figure 2.
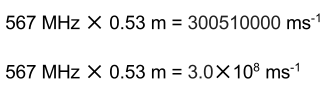
In this example the answer is nine significant figures, but the frequency 567 MHz is three significant figures, and the wavelength, 0.53 m is only two significant figures, so the answer should also be two significant figures, which in this case is best stated in standard form, as shown in Figure 3.
Common exam mistake
Writing down every digit your calculator shows, as in Figure 3, is a very easy way to throw marks away — it claims a level of precision the data simply doesn’t support. The rule is always to look at the least precise piece of data given in the question, not the number of digits on your calculator screen, and round your final answer to match it. This only applies to your final answer, though — don’t round any values used along the way to get there.